


| Front page › Web client › P43 Graphical analyses | Search | Version: 1.41.0 |
Graphical analyses are interactive reports that gives you the opportunity to dive into data by clicking on elements in the analysis.
The purpose of this guide is to show you how to operate the graphical analyses.
All analysis share the same basic layout. The different areas are illustrated and described below.

All criteria, that are not displayed in a diagram or table, are placed in the top of the page in the criteria bar.
Hare you can find the back-arrow as well as breadcrumb path for the previously accessed pages, that you have had open since leaving the start page; Graphical analyses. Pressing the back-arrow, cancels your previous action both selecting a criteria or entering an analysis.
In the action menu it is possible to; remove all selected drill down criteria with one click, or export the analysis to PDF or Excel(.xlsx).
Graphs, tables, etc. are placed within this area of the analysis.
OBS: Graphical analyses does not display rows or colums with a data value of 0.
The analyses are designed with the option of adding criteria for filtering the displayed data. These criteria are placed within the criteria bar in the top of the screen.
Example: If Fiction and Non-fiction are selected as criteria for clacification type, the analysis will be filtered to only displaying data related to these.
By clicking on a data area of a graph or table, it is selected as a criteria for filtering the remaining diagrams in the analysis.
To remove a drill down criteria, you can either click on the area again; click on the back-arrow; or click on the remove drill down button, that removes all activated drill down criteria.
Example: Imagine an analysis with a pie diagram illustrating the items currently Home or On Loan. By clicking on the area of the pie that represents items On Loan, the drill down criteria 'On Loan' is activated and the remaining objects in the analysis will update to only display data relating to items On Loan.
You can access additional functions by right clicking or entering the area of a graph or table with the cursor. These functionalities are explained in the video below and described in the section List of functionalities.
Some analyses contain dynamic criteria relating to time and date. Dynamic criteria allows you to setup criteria such as: year to date, previous month, yesterday, etc.
Example: If you have an analysis, that shows the last 12 months, you can click on date and choose last year that will update according to the current date.
| Icon | Object funktions | Definitions |
|---|---|---|
|
| Back | Rewinds your analysis from your last decision, both in terms of filtration and navigation. |
|
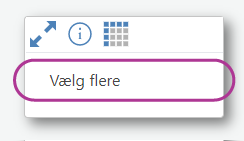
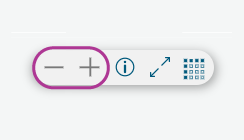
| Multi select | Enables selection of multiple dimension members for drill down selections. This can also be achieved by holding the [Ctrl] button while selecting dimension members. |
|
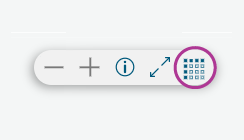
| Show Data / Chart | Toggles between Chart or Table presentation of the same data. |
|
| Maximize / Restore | You can maximize a single object to "full screen", and likewise restore it back to its original position. |
|
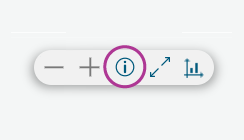
| Explanation | Lists the criteria that currently applies to an object. |
|
| Collapse level / Expand level | If the dimension in an object is a hierarchical dimension, you can use these options to quickly collapse to a previous level or expand all nodes to the next level. |
|
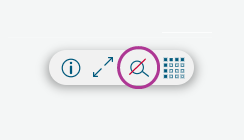
| Drill out | Removes any drill down selections from the object. |
|
| Export to PDF | Exports data from an analysis to a PDF-file (.pdf). |
|
| Export to Excel | Exports data from an analysis, table or graph to en Excel-file (.xlsx). |